
5.3 Reports
5.3.1 Dashboard cards
ActualTime adds six cards to the GLPI dashboards, to compare how much time goes into tickets and who records it.
5.3.1.1 Add the cards to a dashboard
Open Assistance > Dashboard, switch to edit mode and click Add a card: the Actualtime group holds six cards. Top 20 and Bottom 20 Actualtime tasks per day count the tickets with the most and the fewest timed tasks; Top 20 and Bottom 20 Actualtime usage (hours) add up the recorded hours per ticket; Top 20 % and Bottom 20 % Actualtime usage per day give the same ranking as a percentage. The screenshot shows two of the six; the others work the same way. Every card has a date filter and only counts tickets the user may list, skipping tickets in the trash and private tasks the user cannot see.
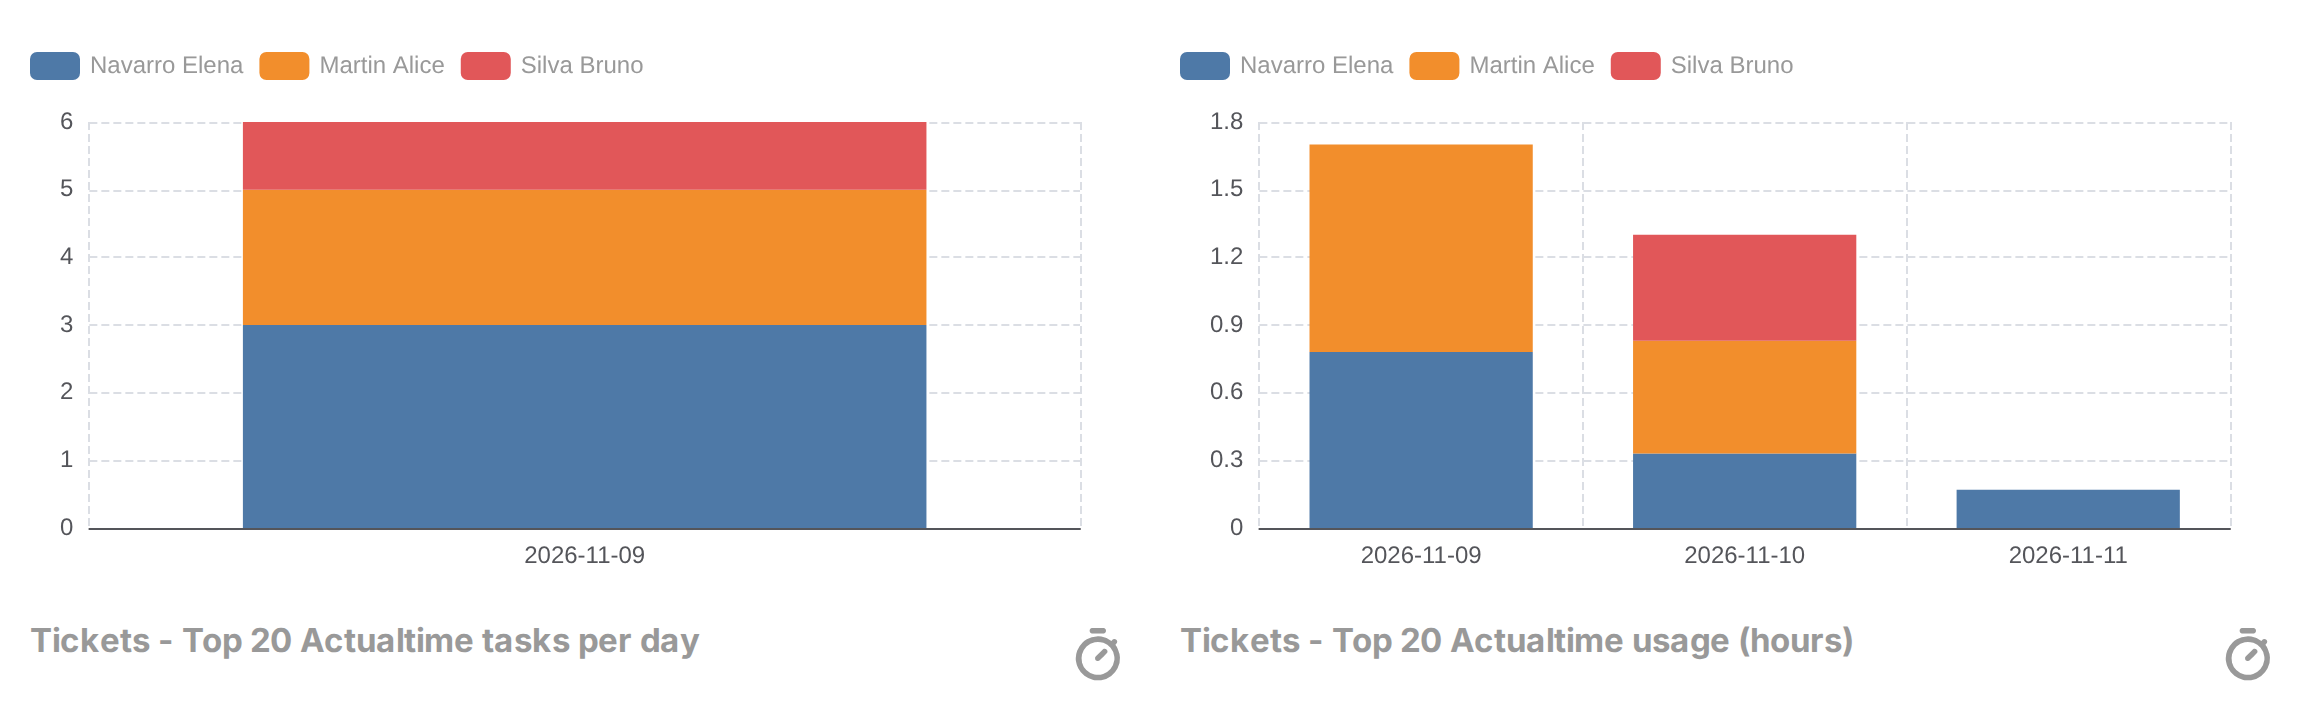
A dashboard with two of the ActualTime cards
5.3.2 Statistics of a ticket
Tickets, changes and problems get extra figures on their Statistics tab: the time recorded with the timers compared with the duration entered on the tasks, in total and per technician.
5.3.2.1 Read the figures per technician
Open the item and click the Statistics tab. ActualTime adds to GLPI's figures: the Total duration entered on the tasks, the ActualTime - Total duration recorded by the timers, the Duration Diff between both (in time and in %, red when more time was recorded than entered), and a table with the same figures for each technician. Tasks that are private only count for users who can see them.
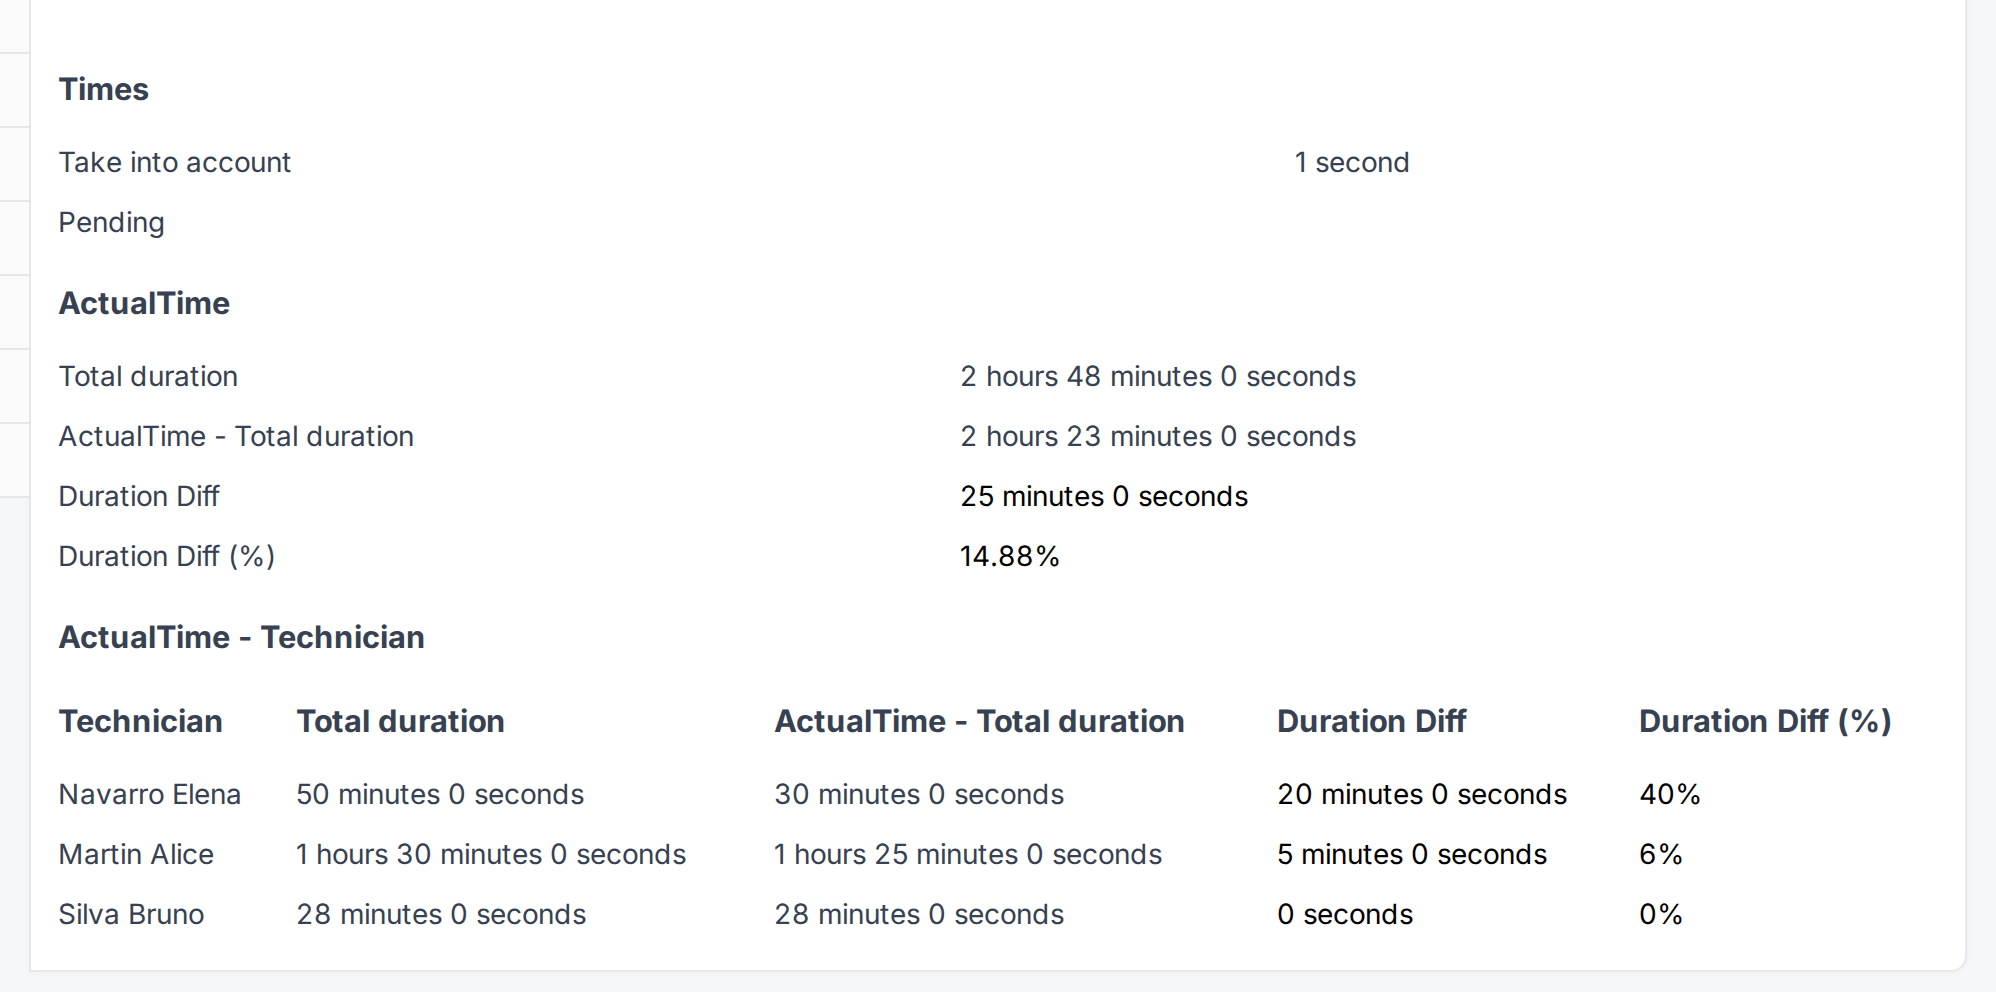
Time recorded per technician
Generated for ActualTime 5.0.0 on GLPI 12.0.2 — 2026-11-19.